CHAPTER 7: Introduction to the Atmosphere
 

(g). Global Patterns of Shortwave Energy Receipts

Average Available Solar Insolation at the Earth's Surface: July 1983-1990
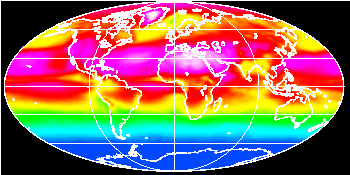
 

Figure 7g-3: Average available solar insolation at the Earth's surface: July 1983-1990. Highest values of available solar insolation over Greenland due to high solar input and low cloud amounts. High values also occur along the subtropics of the Northern Hemisphere. Color range: blue - red - white, Values: 0 - 350 W/m2. Global mean = 180 W/m2, Minimum = 0 W/m2, Maximum = 351 W/m2. (Source: NASA Surface Radiation Budget Project).


Study Guide


Additional Readings

 
Internet Weblinks
 
Citation: Pidwirny, M. (2006). "Global Patterns of Insolation Receipts". Fundamentals of Physical Geography, 2nd Edition. Date Viewed. http://www.physicalgeography.net/fundamentals/7g_2.html


Created by Dr. Michael Pidwirny & Scott Jones University of British Columbia Okanagan

Email Corrections and Suggestions to:

Copyright © 1999-2018 Michael Pidwirny

05/07/2009 15:07


Geography