Climate Classification
The Köppen Climate Classification System is the most widely used system for classifying the world's climates. Its categories are based on the annual and monthly averages of temperature and precipitation. The Köppen system recognizes five major climatic types; each type is designated by a capital letter.
A - Tropical Moist Climates: all months have average temperatures above 18° Celsius.
B - Dry Climates: with deficient precipitation during most of the year.
C - Moist Mid-latitude Climates with Mild Winters.
D - Moist Mid-Latitude Climates with Cold Winters.
E - Polar Climates: with extremely cold winters and summers.
Tropical Moist Climates (A)
Tropical moist climates extend northward and southward from the equator to about 15 to 25° of latitude. In these climates all months have average temperatures greater than 18° Celsius. Annual precipitation is greater than 1500 mm. Three minor Köppen climate types exist in the A group, and their designation is based on seasonal distribution of rainfall. Af or tropical wet is a tropical climate where precipitation occurs all year long. Monthly temperature variations in this climate are less than 3° Celsius. Because of intense surface heating and high humidity, cumulus and cumulonimbus clouds form early in the afternoons almost every day. Daily highs are about 32° Celsius, while night time temperatures average 22° Celsius. Am is a tropical monsoon climate. Annual rainfall is equal to or greater than Af, but most of the precipitation falls in the 7 to 9 hottest months. During the dry season very little rainfall occurs. The tropical wet and dry or savanna (Aw) has an extended dry season during winter. Precipitation during the wet season is usually less than 1000 millimeters, and only during the summer season.
Dry Climates (B)
The most obvious climatic feature of this climate is that potential evaporation and transpiration exceed precipitation. These climates extend from 20 - 35° North and South of the equator and in large continental regions of the mid-latitudes often surrounded by mountains. Minor types of this climate include:
- BW - dry arid (desert) is a true desert climate. It covers 12% of the Earth's land surface and is dominated by xerophytic vegetation. The additional letters h and k are used generally to distinguish whether the dry arid climate is found in the subtropics or in the mid-latitudes, respectively.
- BS - dry semiarid (steppe). Is a grassland climate that covers 14% of the Earth's land surface. It receives more precipitation than the BW either from the intertropical convergence zone or from mid-latitude cyclones. Once again, the additional letters h and k are used generally to distinguish whether the dry semiarid climate is found in the subtropics or in the mid-latitudes, respectively.
Moist Subtropical Mid-Latitude Climates (C)
This climate generally has warm and humid summers with mild winters. Its extent is from 30 to 50° of latitude mainly on the eastern and western borders of most continents. During the winter, the main weather feature is the mid-latitude cyclone. Convective thunderstorms dominate summer months. Three minor types exist: Cfa - humid subtropical; Cs - Mediterranean; and Cfb - marine. The humid subtropical climate (Cfa) has hot muggy summers and frequent thunderstorms. Winters are mild and precipitation during this season comes from mid-latitude cyclones. A good example of a Cfa climate is the southeastern USA. Cfb marine climates are found on the western coasts of continents. They have a humid climate with short dry summer. Heavy precipitation occurs during the mild winters because of the continuous presence of mid-latitude cyclones. Mediterranean climates (Cs) receive rain primarily during winter season from the mid-latitude cyclone. Extreme summer aridity is caused by the sinking air of the subtropical highs and may exist for up to 5 months. Locations in North America are from Portland, Oregon to all of California.
Moist Continental Mid-latitude Climates (D)
Moist continental mid-latitude climates have warm to cool summers and cold winters. The location of these climates is pole ward of the C climates. The average temperature of the warmest month is greater than 10° Celsius, while the coldest month is less than -3° Celsius. Winters are severe with snowstorms, strong winds, and bitter cold from Continental Polar or Arctic air masses. Like the C climates there are three minor types: Dw - dry winters; Ds - dry summers; and Df - wet all seasons.
Polar Climates (E)
Polar climates have year-round cold temperatures with the warmest month less than 10° Celsius. Polar climates are found on the northern coastal areas of North America, Europe, Asia, and on the landmasses of Greenland and Antarctica. Two minor climate types exist. ET or polar tundra is a climate where the soil is permanently frozen to depths of hundreds of meters, a condition known as permafrost. Vegetation is dominated by mosses, lichens, dwarf trees and scattered woody shrubs. EF or polar ice caps has a surface that is permanently covered with snow and ice.
Factors Influencing the World Climatic Regions
So far in this online textbook we have discovered that the climate of a particular place is the function of a number of factors. These factors include:
1) Latitude and its influence on solar radiation received.
2) Air mass influences.
3) Location of global high and low pressure zones.
4) Heat exchange from ocean currents.
5) Distribution of mountain barriers.
6) Pattern of prevailing winds.
7) Distribution of land and sea.
8) Altitude.
At a macro-level, the first three factors are most important in influencing a region's climate. The animated graphic below provides us with a generalized model of the Earth's annual climatic variations. It also describes the latitudinal effects of these top three factors through the following climatic features:
- Relative annual latitudinal location of the overhead Sun at solar noon.
- Intertropical convergence zone and its area of uplift, cloud development and precipitation.
- Subtropical high pressure zone and its associated descending air currents and clear skies.
- Polar front and its area of uplift, cloud development and precipitation.
- Polar vortex and its associated descending air currents and clear skies.
- Relative location of tropical/subtropical (red)
and polar (light blue)
air masses.
In the animation we can see that the intertropical convergence zone, the subtropical high pressure zone, polar front and the position of tropical/subtropical and polar air masses all move in response to the seasonal movements of the Sun. It is important to understand this concept because of its climatic ramifications for locations on the globe. The type of climate that a location experiences is to a large extent a function of seasonal migration of these weather features. For example, a location at 15° North latitude is influenced by the subtropical high pressure zone during winter solstice and by the intertropical convergence zone during the summer solstice. Another location, at 60° North latitude, would be influenced by polar air masses during the winter solstice, the polar front during the equinoxes, and by subtropical air masses and the subtropical high pressure zone during the summer solstice.
When studying about the Earth's Climatic Regions as described below, use this animation (Figure 7v-1) as a guide to understanding the large scale climatic processes that produce each location's particular climate.
Figure 7v-1: Solar influence on the movement of the Earth's global circulation patterns.
Climatic Region Descriptions
The following discussion organizes the climatic regions of the world into eight different groups. Categorization of these climates is based on their Köppen classification and seasonal dominance of air masses.
Tropical Wet
- Köppen Classification - Af.
- Dominated by Maritime Tropical air masses all year long.
The tropical wet climate is characterized by somewhat consistent daily high temperatures ranging between 20 to 30° Celsius. The monthly temperature averages vary from 24 to 30° Celsius. Annual range of monthly temperatures is about 3° Celsius. It has reasonably uniform precipitation all year round, and total rainfall over 2000 millimeters or greater.
The region experiencing this climate lies within the effects of the intertropical convergence zone all year long. Convergence and high maritime humidity creates cumulus clouds and thunderstorms almost daily.
Af - Andagoya, Columbia 5° N , Elevation: 65 m
| Jan. | Feb. | Mar. | Apr. | May | June | July | Aug. | Sept. | Oct. | Nov. | Dec. | Year | |
| Temp. ° C | 27 | 27 | 28 | 28 | 27 | 27 | 27 | 27 | 27 | 27 | 27 | 27 | 27 |
| Precip. mm | 554 | 519 | 557 | 620 | 655 | 655 | 572 | 574 | 561 | 563 | 563 | 512 | 6905 |
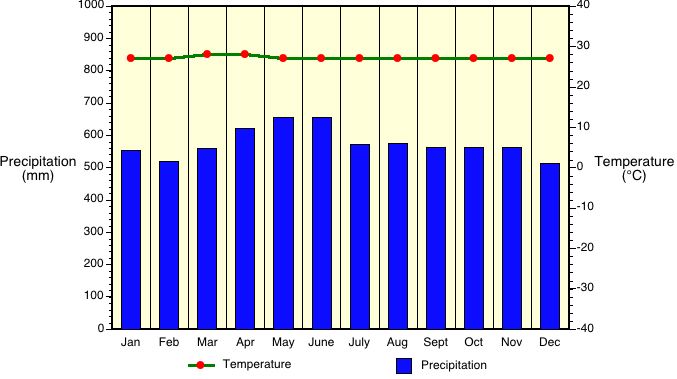
Figure 7v-2: Mean monthly temperature and precipitation values for Andagoya, Columbia.
Af - Iquitos, Peru 4° S , Elevation: 104 m
| Jan. | Feb. | Mar. | Apr. | May | June | July | Aug. | Sept. | Oct. | Nov. | Dec. | Year | |
| Temp. ° C | 27 | 27 | 27 | 27 | 26 | 26 | 25 | 27 | 27 | 27 | 27 | 27 | 26 |
| Precip. mm | 256 | 276 | 349 | 306 | 271 | 199 | 165 | 157 | 191 | 214 | 244 | 217 | 2845 |
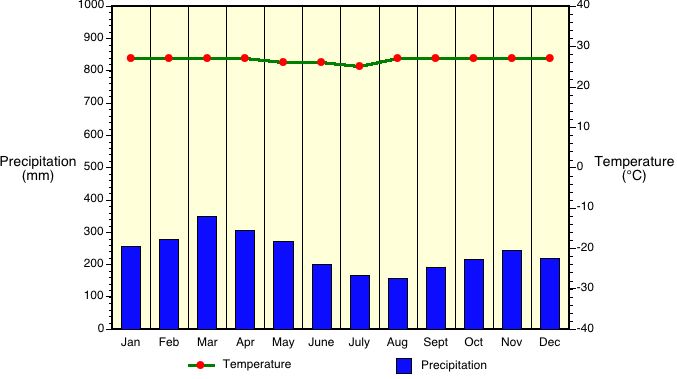
Figure 7v-3: Mean monthly temperature and precipitation values for Iquitos, Peru.
Tropical Wet and Dry
- Köppen Classification - Aw and Am.
- Maritime Tropical air masses high Sun season and Continental Tropical air masses low Sun season.
This climate has distinct wet/dry periods. The seasonal pattern of moisture is due to the migration of the intertropical convergence zone. The wet season is synchronous with the high Sun and the presence of the convergence zone. The dry season is a result of the more stable air developing from the subsidence associated with the presence of the subtropical high zone during the low Sun season.
During the rainy season, the climate of this location is similar to the tropical wet climate: warm, humid, and has frequent thunderstorms. During the dry season more or less semi-desert conditions prevail. Some regions may experience intensification of rainfall because of monsoon development and orographic uplift.
Aw - Calcutta, India 22.5° N , Elevation: 6 m
| Jan. | Feb. | Mar. | Apr. | May | June | July | Aug. | Sept. | Oct. | Nov. | Dec. | Year | |
| Temp. ° C | 20 | 23 | 28 | 30 | 31 | 30 | 29 | 29 | 30 | 28 | 24 | 21 | 27 |
| Precip. mm | 13 | 24 | 27 | 43 | 121 | 259 | 301 | 306 | 290 | 160 | 35 | 3 | 1582 |
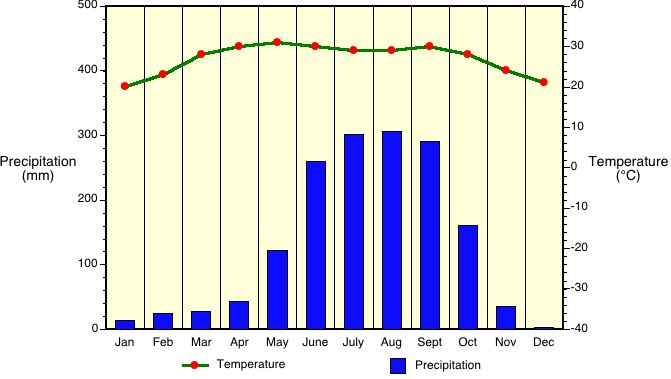
Figure 7v-4: Mean monthly temperature and precipitation values for Calcutta, India.
Aw - Cuiaba, Brazil 13.5° S , Elevation: 165 m
| Jan. | Feb. | Mar. | Apr. | May | June | July | Aug. | Sept. | Oct. | Nov. | Dec. | Year | |
| Temp. ° C | 27 | 27 | 27 | 27 | 26 | 24 | 24 | 26 | 28 | 28 | 28 | 27 | 27 |
| Precip. mm | 216 | 198 | 232 | 116 | 52 | 13 | 9 | 12 | 37 | 130 | 165 | 195 | 1375 |
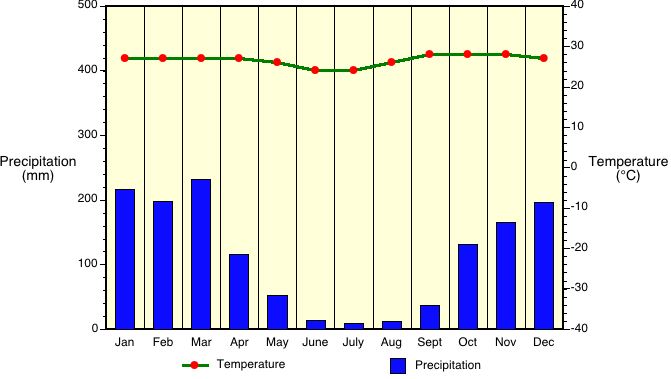
Figure 7v-5: Mean monthly temperature and precipitation values for Cuiaba, Brazil.
Aw - Darwin, Australia 12.5° S , Elevation: 27 m
| Jan. | Feb. | Mar. | Apr. | May | June | July | Aug. | Sept. | Oct. | Nov. | Dec. | Year | |
| Temp. ° C | 28 | 28 | 28 | 28 | 27 | 25 | 25 | 26 | 28 | 29 | 29 | 29 | 28 |
| Precip. mm | 341 | 338 | 274 | 121 | 9 | 1 | 2 | 5 | 17 | 66 | 156 | 233 | 1563 |
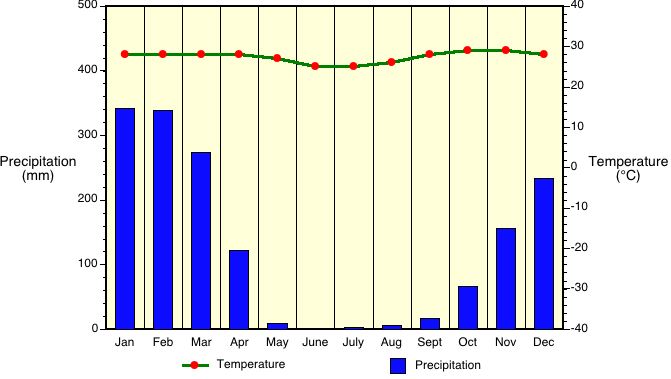
Figure 7v-6: Mean monthly temperature and precipitation values for Darwin, Australia.
Am - Mangalore, India 13° N , Elevation: 22 m
| Jan. | Feb. | Mar. | Apr. | May | June | July | Aug. | Sept. | Oct. | Nov. | Dec. | Year | |
| Temp. ° C | 27 | 27 | 28 | 29 | 29 | 27 | 26 | 26 | 26 | 27 | 27 | 27 | 27 |
| Precip. mm | 5 | 2 | 9 | 40 | 233 | 982 | 1059 | 577 | 267 | 206 | 71 | 18 | 3467 |
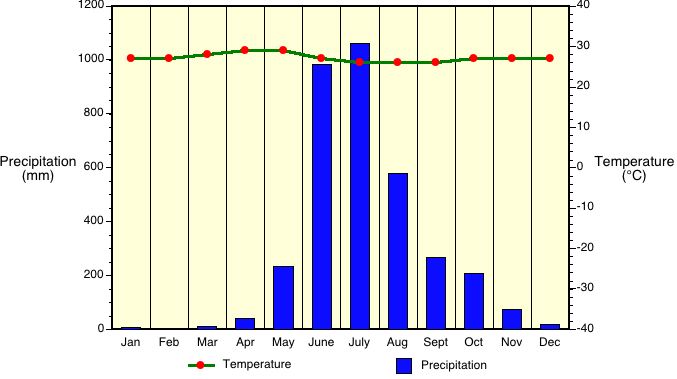
Figure 7v-7: Mean monthly temperature and precipitation values for Mangalore, India.
Subtropical Desert and Steppe
- Köppen Classification - BWh and BSh.
- Dominated by Continental Tropical air masses all year.
This climate type covers 12 percent of all land area on the continents. The heart of the tropical desert climate is found near the tropics of Cancer and Capricorn, usually toward the western side of the continents. Regions with this climate have the following common climatic characteristics:
- low relative humidity and cloud cover.
- low frequency and amount of precipitation.
- high mean annual temperature.
- high monthly temperatures.
- high diurnal temperature ranges.
- high wind velocities.
The tropical desert climate is influenced by upper air stability and subsidence which is the result of the presence of the subtropical high pressure zone. Relative humidity is normally low, averaging 10 to 30 percent in interior locations. Precipitation is very low in quantity and very infrequent in distribution, both temporally and spatially.
Temperature varies greatly both diurnally and annually. The highest average monthly temperatures on the Earth are found in the tropical desert. They range between 29 to 35° Celsius. Winter monthly temperatures can be 15 to 25° cooler than summer temperatures. This climate also has extreme diurnal ranges of temperature. The average diurnal range is from 14 to 25° Celsius.
BWh - Berbera, Somalia 10.5° N , Elevation: 8 m
| Jan. | Feb. | Mar. | Apr. | May | June | July | Aug. | Sept. | Oct. | Nov. | Dec. | Year | |
| Temp. ° C | 25 | 26 | 27 | 29 | 32 | 37 | 37 | 37 | 34 | 29 | 26 | 26 | 30 |
| Precip. mm | 8 | 2 | 5 | 12 | 8 | 1 | 1 | 2 | 1 | 2 | 5 | 5 | 52 |
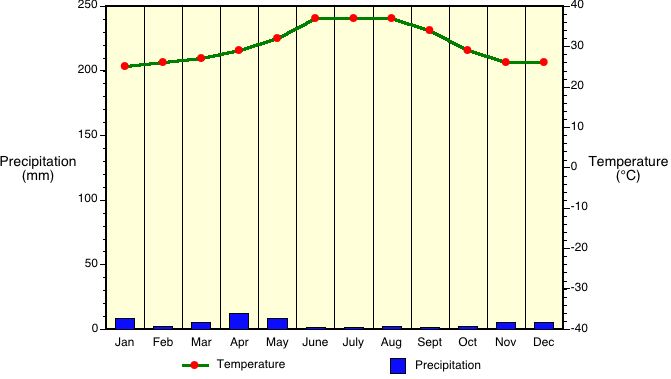
Figure 7v-8: Mean monthly temperature and precipitation values for Berbera, Somalia.
BWh - Alice Springs, Australia 23.5° S , Elevation: 579 m
| Jan. | Feb. | Mar. | Apr. | May | June | July | Aug. | Sept. | Oct. | Nov. | Dec. | Year | |
| Temp. ° C | 28 | 28 | 25 | 20 | 15 | 12 | 12 | 14 | 18 | 23 | 26 | 27 | 21 |
| Precip. mm | 44 | 34 | 28 | 10 | 15 | 13 | 7 | 8 | 7 | 18 | 29 | 39 | 252 |
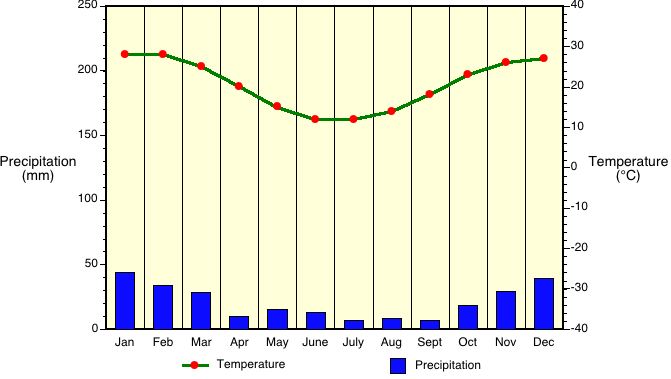
Figure 7v-9: Mean monthly temperature and precipitation values for Alice Springs, Australia.
BSh - Monterrey, Mexico 26° N , Elevation: 512 m
| Jan. | Feb. | Mar. | Apr. | May | June | July | Aug. | Sept. | Oct. | Nov. | Dec. | Year | |
| Temp. ° C | 14 | 17 | 20 | 23 | 26 | 27 | 28 | 28 | 26 | 22 | 18 | 15 | 22 |
| Precip. mm | 18 | 23 | 16 | 29 | 40 | 68 | 62 | 151 | 78 | 26 | 29 | 20 | 606 |
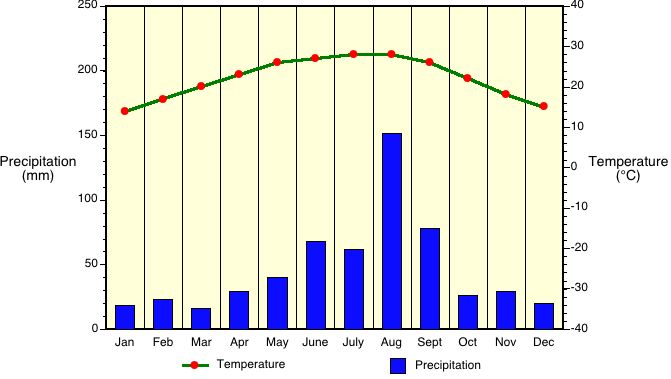
Figure 7v-10: Mean monthly temperature and precipitation values for Monterrey, Mexico.
Mid-Latitude Desert and Steppe
- Köppen Classification - BWk and BSk.
- Dominated by Continental Tropical air masses during summer and Continental Polar in winter.
- low relative humidity and cloud cover.
- low frequency and amount of precipitation.
- moderate to high annual temperature.
- moderate to high monthly temperatures.
These climates are dry because of extreme continentality and the effect of high elevations. Being located at the center of a continent limits the amount of moisture supplied from ocean sources. Without this moisture precipitation can not occur. The presence of mountains upwind of these climates can further reduce moisture availability because of the rainshadow effect. Major expanses of mid-latitude deserts can be found east of the Caspian Sea, north of the Himalayas, in western United States, and east of the Andes in a narrow region in southern South America. Mid-latitude deserts have a greater range of both daily and annual temperatures than their subtropical counterparts. In most cases, summer temperatures are not as high in mid-latitude deserts when compared to subtropical deserts. There are, however, exceptions like Death Valley, California which is one of the hottest places on our planet. Winter temperatures tend to be quite cool.
Mid-latitude steppe climates cover considerable parts of western North America and central Asia. This climate generally has similar temperature characteristics as mid-latitude deserts. However, mid-latitude steppe climates do receive slightly more precipitation than mid-latitude deserts.
BWk - Lovelock, Nevada, USA 40° N , Elevation: 1211 m
Jan. Feb. Mar. Apr. May June July Aug. Sept. Oct. Nov. Dec. Year Temp. ° C 0 4 6 10 15 20 24 22 18 12 5 0 11 Precip. mm 16 16 11 14 13 14 4 6 7 13 13 15 143
Figure 7v-11: Mean monthly temperature and precipitation values for Lovelock, USA.
BSk - Denver, Colorado, USA 40° N , Elevation: 1611 m
Jan. Feb. Mar. Apr. May June July Aug. Sept. Oct. Nov. Dec. Year Temp. ° C -1 1 4 9 14 19 23 22 17 11 4 -1 10 Precip. mm 14 16 34 45 63 43 47 38 28 26 23 15 391
Figure 7v-12: Mean monthly temperature and precipitation values for Denver, USA.
BSk - Williston, North Dakota, USA 47.5° N , Elevation: 579 m
Jan. Feb. Mar. Apr. May June July Aug. Sept. Oct. Nov. Dec. Year Temp. ° C -12 -10 -4 6 13 17 22 20 14 8 -2 -8 5 Precip. mm 14 12 18 24 36 84 48 38 28 19 15 13 349
Figure 7v-13: Mean monthly temperature and precipitation values for Williston, USA.
Mid-Latitude Wet
- Köppen Classification - Cf and Df.
- Maritime Tropical in summer and Maritime Polar in winter.
The Mid-Latitude Wet climate is found in the Northern Hemisphere in the region from 60° North to 25 to 30° North mainly along the eastern margins of the continents. In North America, this climate extends from the Pacific coast of Canada at latitudes above 55° eastward to the Atlantic coast where it dominates the eastern half of the continent. In the Southern Hemisphere, this climate exists on the Southeastern tip of South America, New Zealand and the Southeast coast of Australia.
Summer weather is dominated by Maritime Tropical air masses which produce many thunderstorms from daytime heating. Monthly average temperature ranges from 21 to 26° Celsius with the tropical areas going as high as 29° Celsius. This is slightly warmer than the humid tropics. Frontal weather associated with the mid-latitude cyclone dominates the climate of more polar areas and is more frequent in all regions in the winter.
Precipitation in this climate is fairly evenly distributed throughout the year. Annual totals of precipitation are quite variable and depend on the latitude and continental position of the regions. During the summer and on the equatorial margins, convectional rainfall is the primary mechanism of precipitation. The southeast of the United Sates averages 40 to 60 days of thunderstorms per year. The frequency of thunderstorms decreases rapidly from south to north. Hurricanes also provide a mechanism for producing precipitation in more tropical regions of this climate.
Cf - New Orleans, USA 30° N , Elevation: 1 m
| Jan. | Feb. | Mar. | Apr. | May | June | July | Aug. | Sept. | Oct. | Nov. | Dec. | Year | |
| Temp. ° C | 12 | 13 | 16 | 20 | 24 | 27 | 28 | 28 | 26 | 21 | 16 | 13 | 20 |
| Precip. mm | 98 | 101 | 136 | 116 | 111 | 113 | 171 | 136 | 128 | 72 | 85 | 104 | 1371 |
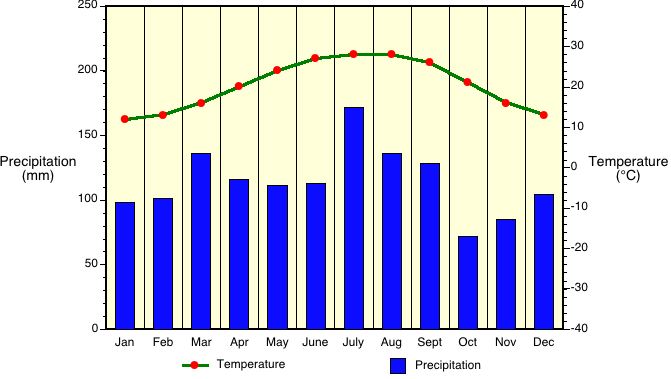
Figure 7v-14: Mean monthly temperature and precipitation values for New Orleans, USA.
Cf - Buenos Aires, Argentina 34.5° S , Elevation: 27 m
| Jan. | Feb. | Mar. | Apr. | May | June | July | Aug. | Sept. | Oct. | Nov. | Dec. | Year | |
| Temp. ° C | 23 | 23 | 21 | 17 | 13 | 9 | 10 | 11 | 13 | 15 | 19 | 22 | 16 |
| Precip. mm | 103 | 82 | 122 | 90 | 79 | 68 | 61 | 68 | 80 | 100 | 90 | 83 | 1026 |
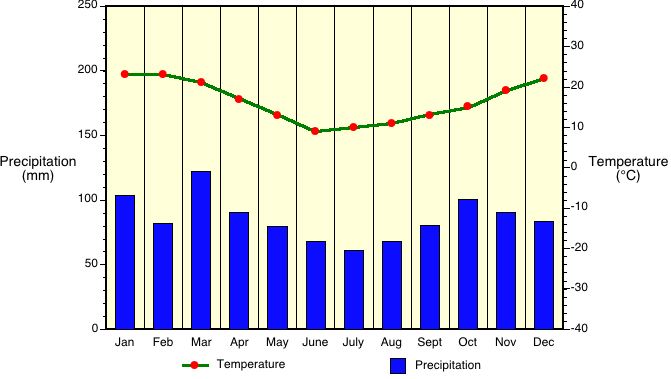
Figure 7v-15: Mean monthly temperature and precipitation values for Buenos Aires, Argentina.
Cf - London, England 51.5° N , Elevation: 5 m
| Jan. | Feb. | Mar. | Apr. | May | June | July | Aug. | Sept. | Oct. | Nov. | Dec. | Year | |
| Temp. ° C | 4 | 4 | 7 | 9 | 12 | 16 | 18 | 17 | 15 | 11 | 7 | 5 | 10 |
| Precip. mm | 54 | 40 | 37 | 38 | 46 | 46 | 56 | 59 | 50 | 57 | 64 | 48 | 595 |
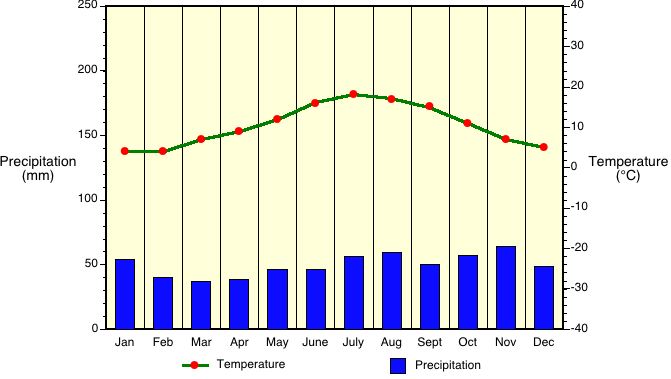
Figure 7v-16: Mean monthly temperature and precipitation values for London, England.
Df - Winnipeg, Canada 50° N , Elevation: 240 m
| Jan. | Feb. | Mar. | Apr. | May | June | July | Aug. | Sept. | Oct. | Nov. | Dec. | Year | |
| Temp. ° C | -18 | -16 | -8 | 3 | 11 | 17 | 20 | 19 | 13 | 6 | -5 | -13 | 3 |
| Precip. mm | 26 | 21 | 27 | 30 | 50 | 81 | 69 | 70 | 55 | 37 | 29 | 22 | 517 |
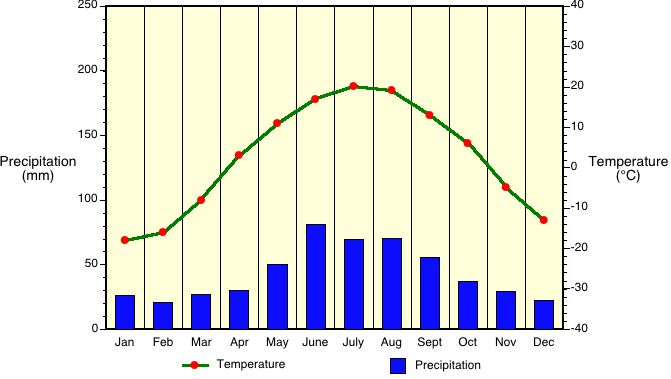
Figure 7v-17: Mean monthly temperature and precipitation values for Winnipeg, Canada.
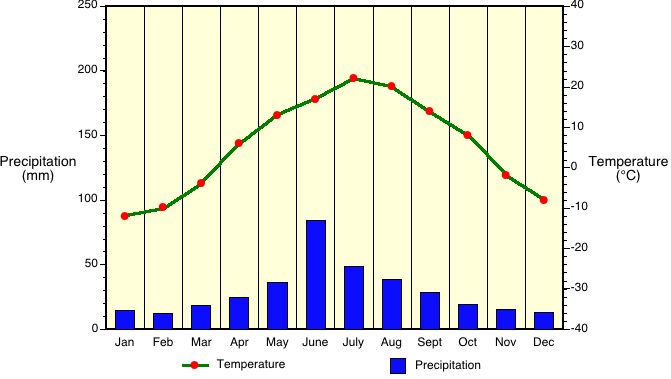
Mid-Latitude Winter-Dry
- Köppen Classification - Cw and Dw.
- Maritime Tropical air masses in summer and Continental Polar air masses in winter.
This climate is characterized by a strong seasonal pattern of both temperature and precipitation. The normal location of the Mid-Latitude Winter-Dry climate is in the interior of the continents in the mid-latitudes. This continental location causes a large annual temperature range because of continentality.
This climate receives Maritime Tropical air masses in the summer with occasional Continental Tropical air masses from the adjacent deserts. Summers are hot and humid with intense summer convectional storms. Continental Polar air masses are dominant in the winter with an occasional outbreak of Maritime Polar air. Continental Polar air masses are associated with cold, dry weather conditions. Precipitation mainly occurs in the summer from thunderstorm activity. The mid-latitude cyclone produces a smaller quantity of precipitation in the winter.
Dfa - Omaha, Nebraska, USA 41° N , Elevation: 298 m
| Jan. | Feb. | Mar. | Apr. | May | June | July | Aug. | Sept. | Oct. | Nov. | Dec. | Year | |
| Temp. ° C | -5 | -3 | 3 | 11 | 17 | 23 | 26 | 25 | 19 | 13 | 4 | -2 | 11 |
| Precip. mm | 21 | 24 | 37 | 65 | 88 | 115 | 86 | 101 | 67 | 44 | 32 | 20 | 700 |
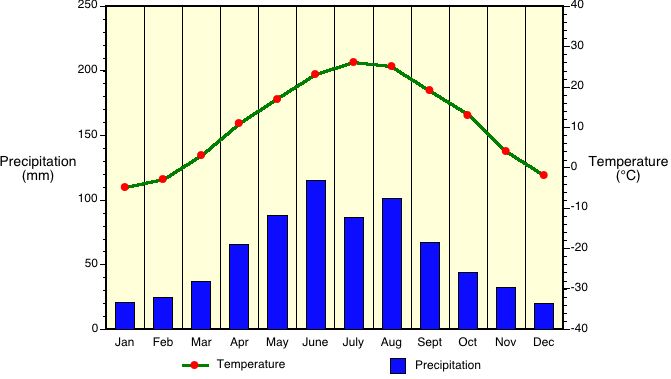
Figure 7v-18: Mean monthly temperature and precipitation values for Omaha, USA.
Dw - Calgary, Canada 51° N , Elevation: 1140 m
| Jan. | Feb. | Mar. | Apr. | May | June | July | Aug. | Sept. | Oct. | Nov. | Dec. | Year | |
| Temp. ° C | -10 | -9 | -4 | 4 | 10 | 13 | 17 | 15 | 11 | 5 | -2 | -7 | 4 |
| Precip. mm | 17 | 20 | 26 | 35 | 52 | 88 | 58 | 59 | 35 | 23 | 16 | 15 | 444 |
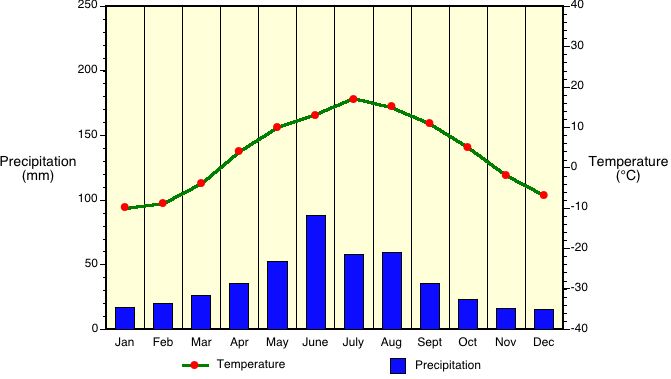
Figure 7v-19: Mean monthly temperature and precipitation values for Calgary, Canada.
Mid-Latitude Summer-Dry
- Köppen Classification - Cs.
- Summer weather is dominated by Continental Tropical air, while in the winter, Maritime Polar air masses are frequent.
The Mid-Latitude Summer-Dry climate is found on the western margins of the continents between 30 to 40° of latitude. Usually, this climate does not spread into the continents very far. This climate is often called a Mediterranean climate.
Precipitation falls mainly in the winter in this climate via the mid-latitude cyclone. During the summer these areas are influenced by stable subtropical highs, that give them dry, warm weather.
Cs - Santiago, Chile 33.5° S , Elevation: 512 m
| Jan. | Feb. | Mar. | Apr. | May | June | July | Aug. | Sept. | Oct. | Nov. | Dec. | Year | |
| Temp. ° C | 19 | 19 | 17 | 13 | 11 | 8 | 8 | 9 | 11 | 13 | 16 | 19 | 14 |
| Precip. mm | 3 | 3 | 5 | 13 | 64 | 84 | 76 | 56 | 30 | 13 | 8 | 5 | 360 |
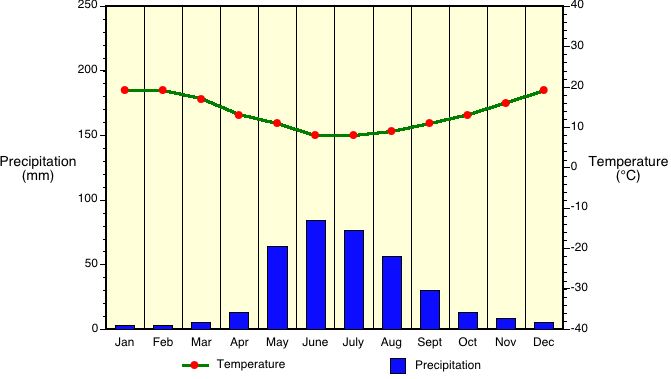
Figure 7v-20: Mean monthly temperature and precipitation values for Santiago, Chile.
Cs - Los Angeles, USA 34° N , Elevation: 37 m
| Jan. | Feb. | Mar. | Apr. | May | June | July | Aug. | Sept. | Oct. | Nov. | Dec. | Year | |
| Temp. ° C | 13 | 14 | 15 | 17 | 18 | 20 | 23 | 23 | 22 | 18 | 17 | 15 | 18 |
| Precip. mm | 78 | 85 | 57 | 30 | 4 | 2 | 0 | 1 | 6 | 10 | 27 | 73 | 373 |
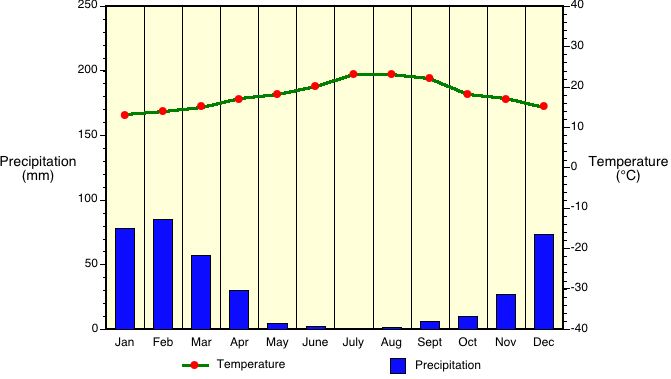
Figure 7v-21: Mean monthly temperature and precipitation values for Los Angeles, USA.
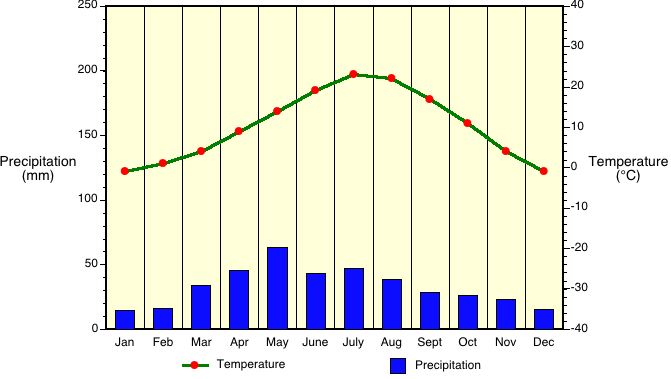
Cs - Rome, Italy 42° N , Elevation: 131 m
| Jan. | Feb. | Mar. | Apr. | May | June | July | Aug. | Sept. | Oct. | Nov. | Dec. | Year | |
| Temp. ° C | 8 | 8 | 10 | 13 | 17 | 22 | 24 | 24 | 21 | 16 | 12 | 9 | 15 |
| Precip. mm | 76 | 88 | 77 | 72 | 63 | 48 | 14 | 22 | 70 | 128 | 116 | 106 | 881 |
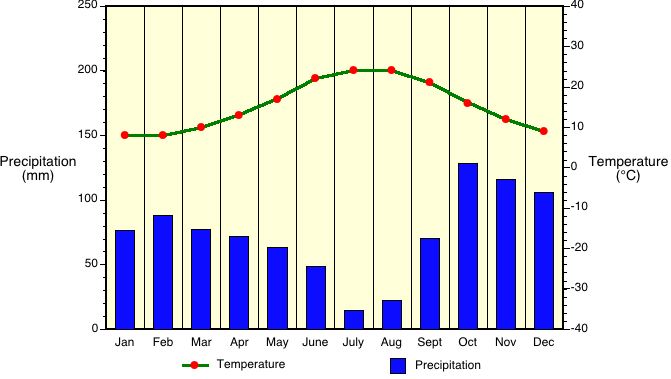
Figure 7v-22: Mean monthly temperature and precipitation values for Rome, Italy.
Polar Tundra
- Köppen Classification - ET.
- Maritime Polar in summer and Continental Polar or Arctic in winter.
The polar tundra climate is characterized by cold winters, cool summers, and a summer rainfall regime. Areas experiencing this climate are the North American Arctic coast, Iceland, coastal Greenland, the Arctic coast of Europe and Asia, and the Southern Hemisphere islands of McQuarie, Kerguelen, and South Georgia. Annual precipitation averages less than 250 mm for most locations and most of this precipitation falls during the summer.
ET - Isachsen, Canada 79° N , Elevation: 35 m
| Jan. | Feb. | Mar. | Apr. | May | June | July | Aug. | Sept. | Oct. | Nov. | Dec. | Year | |
| Temp. ° C | -35 | -37 | -35 | -24 | -12 | 0 | 4 | 1 | -8 | -19 | -28 | -32 | -19 |
| Precip. mm | 2 | 2 | 1 | 4 | 8 | 3 | 22 | 23 | 18 | 10 | 4 | 2 | 98 |
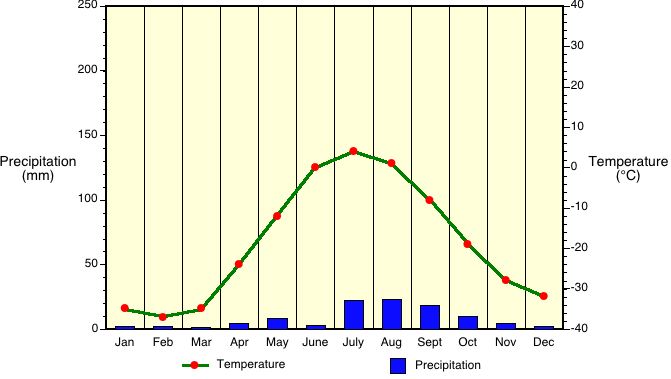
Figure 7v-23: Mean monthly temperature and precipitation values for Isachen, Canada.
ET - Barrow, Alaska, USA 72° N , Elevation: 9 m
| Jan. | Feb. | Mar. | Apr. | May | June | July | Aug. | Sept. | Oct. | Nov. | Dec. | Year | |
| Temp. ° C | -25 | -28 | -26 | -19 | -7 | 1 | 4 | 3 | -1 | -10 | -19 | -24 | -13 |
| Precip. mm | 5 | 4 | 4 | 4 | 4 | 8 | 22 | 25 | 16 | 12 | 6 | 4 | 113 |
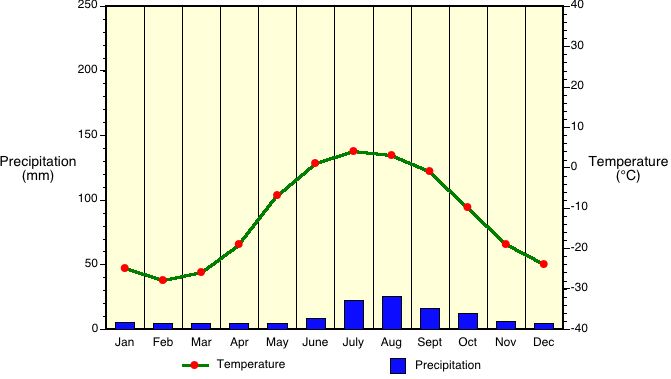
Figure 7v-24: Mean monthly temperature and precipitation values for Barrow, USA.
Polar Ice Cap
- Köppen Classification - EF.
- Continental Arctic and Continental Polar air masses dominate.
Polar ice cap climates are located in the high latitudes over continental areas, like Greenland and the Antarctica. This climate type covers a vast area of the planet. For half of the year no solar radiation is received. During the summer months, available insolation is fairly high because of long days and a relatively transparent atmosphere. However, the albedo of snow-covered surfaces reflects up 90 percent of the insolation back to space. Average monthly temperatures are all generally below zero° Celsius. Winds are consistent and velocity is high enough to produce blizzard conditions most of the time.
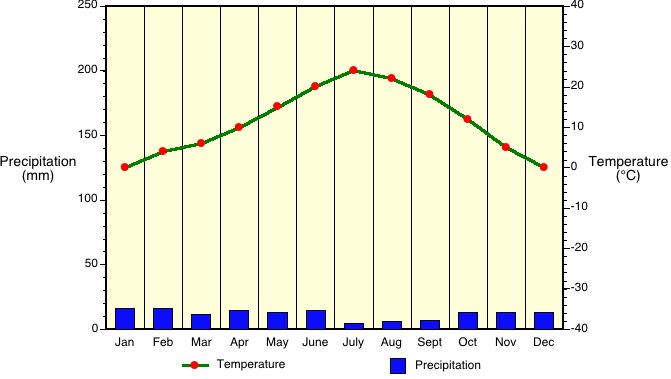
EF - Eismitte, Greenland 71° N , Elevation: 2953 m
| Jan. | Feb. | Mar. | Apr. | May | June | July | Aug. | Sept. | Oct. | Nov. | Dec. | Year | |
| Temp. ° C | -42 | -47 | -40 | -32 | -24 | -17 | -12 | -11 | -11 | -36 | -43 | -38 | -29 |
| Precip. mm | 15 | 5 | 8 | 5 | 3 | 3 | 3 | 10 | 8 | 13 | 13 | 25 | 111 |
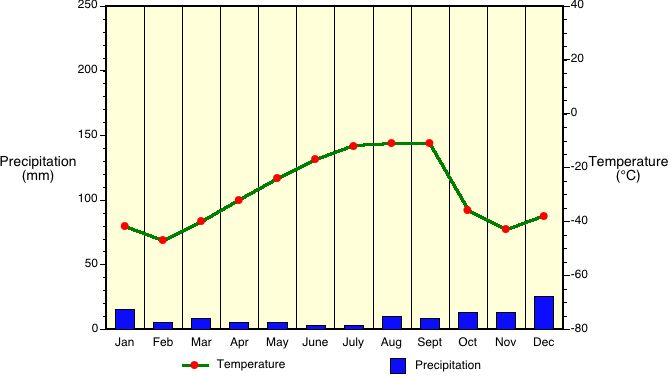
Figure 7v-25: Mean monthly temperature and precipitation values for Eismitte, Greenland.
EF - Plateau Station, Antarctica 79° S , Elevation: 3625 m
| Jan. | Feb. | Mar. | Apr. | May | June | July | Aug. | Sept. | Oct. | Nov. | Dec. | Year | |
| Temp. ° C | -34 | -44 | -57 | -66 | -66 | -69 | -68 | -71 | -65 | -60 | -44 | -32 | -56 |
| Precip. mm | NA | NA | NA | NA | NA | NA | NA | NA | NA | NA | NA | NA | NA |
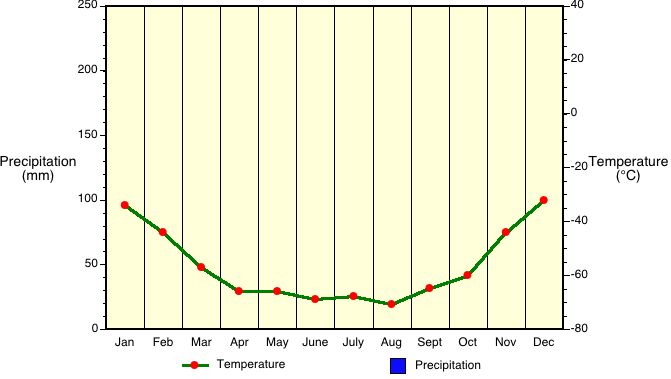
Figure 7v-26: Mean monthly temperature and precipitation values for Plateau Station, Antarctica.