Thunderstorms
Thunderstorms form when moist, unstable air is lifted vertically into the atmosphere. Lifting of this air results in condensation and the release of latent heat. The process to initiate vertical lifting can be caused by:
(1). Unequal warming of the surface of the Earth.
(2). Orographic lifting due to topographic obstruction of air flow.
(3). Dynamic lifting because of the presence of a frontal zone.
Immediately after lifting begins, the rising parcel of warm moist air begins to cool because of adiabatic expansion. At a certain elevation the dew point is reached resulting in condensation and the formation of a cumulus cloud. For the cumulus cloud to form into a thunderstorm, continued uplift must occur in an unstable atmosphere. With the vertical extension of the air parcel, the cumulus cloud grows into a cumulonimbus cloud. Cumulonimbus clouds can reach heights of 20 kilometers above the Earth's surface. Severe weather associated with some these clouds includes hail, strong winds, thunder, lightning, intense rain, and tornadoes.

| Figure 7t-1: Hail stone measuring 6 centimeters in diameter. (Source: NOAA Photo Library - National Severe Storms Laboratory). |
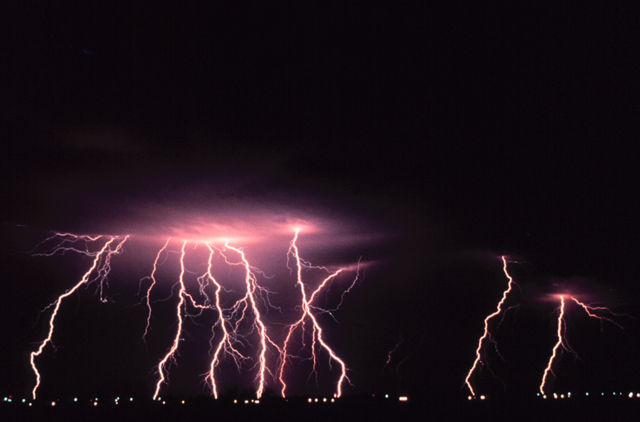
| Figure 7t-2: Multiple lightning strikes from a thunderstorm occurring at night. (Source: NOAA Photo Library - National Severe Storms Laboratory). |
Generally, two types of thunderstorms are common:
1) Air mass thunderstorms which occur in the mid-latitudes in summer and at the equator all year long.
2) Thunderstorms associated with mid-latitude cyclone cold fronts or dry lines. This type of thunderstorm often has severe weather associated with it.
The most common type of thunderstorm is the air mass storm. Air mass thunderstorms normally develop in late afternoon hours when surface heating produces the maximum number of convection currents in the atmosphere. The life cycle of these weather events has three distinct stages. The first stage of air mass thunderstorm development is called the cumulus stage (Figure 7t-3). In this stage, parcels of warm humid air rise and cool to form clusters of puffy white cumulus clouds. The clouds are the result of condensation and deposition which releases large quantities of latent heat. The added heat energy keeps the air inside the cloud warmer than the air around it. The cloud continues to develop as long as more humid air is added to it from below. Updrafts dominate the circulation patterns within the cloud.
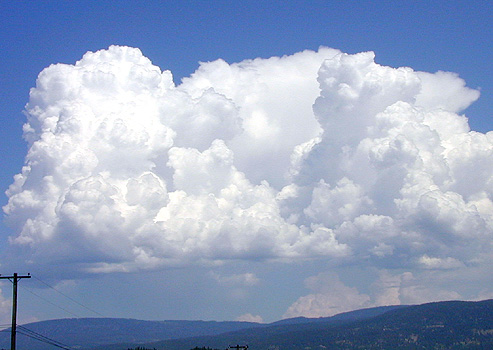
|
Figure
7t-3: Developing
thunderstorm cloud at the cumulus stage. |
When the updrafts reach their maximum altitude in the developing cloud, usually 12 to 14 kilometers, they change their direction 180° and become downdrafts. This marks the mature stage (Figure 7t-4). With the downdrafts, precipitation begins to form through collision and coalescence (Figure 7t-5). The storm is also at its most intense stage of development and is now a cumulonimbus cloud The top of the cloud takes on the familiar anvil shape, as strong stratospheric upper-level winds spread ice crystals in the top of the cloud horizontally. At its base, the thunderstorm is several kilometers in diameter. The mature air mass thunderstorm contains heavy rain, thunder, lightning, and produces wind gusts at the surface.
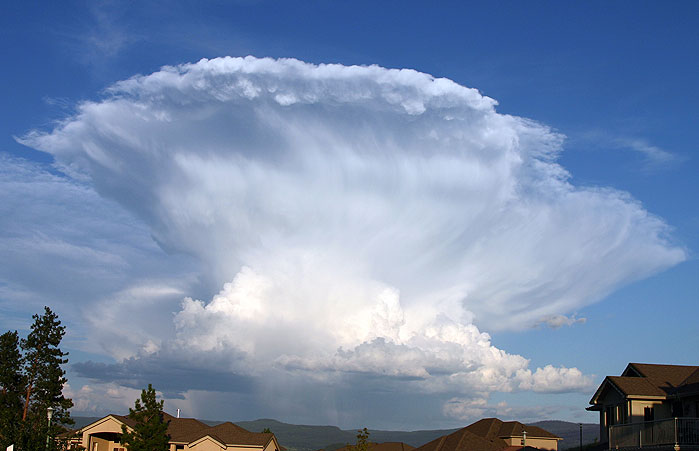
| Figure 7t-4: Mature thunderstorm cloud with typical anvil shaped cloud. |
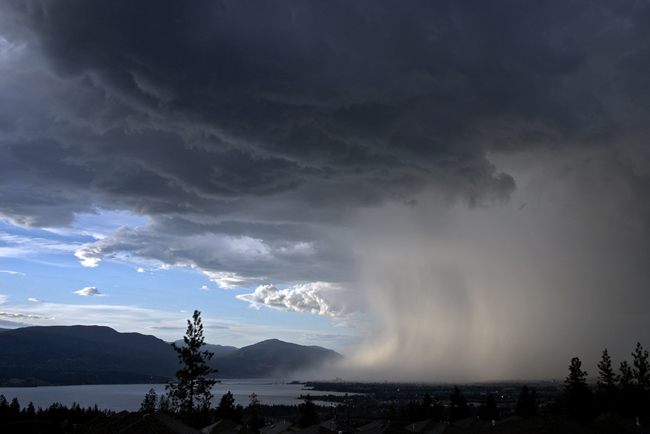
| Figure 7t-5: Downdrafts from this mature thunderstorm are moving air and rain from the cloud to the ground surface (Photo © 2004 David Jenkins). |
The mature thunderstorm begins to decrease in intensity and enters the dissipating stage after about half an hour. Air currents within the convective storm are now mainly downdrafts as the supply of warm moist air from the lower atmosphere is depleted. Within about 1 hour, the storm is finished and precipitation has stopped.
Thunderstorms form from the equator to as far north as Alaska. They occur most commonly in the tropics were convectional heating of moist surface air occurs year round. Many tropical land based locations experience over 100 thunderstorm days per year. Thunderstorm formation over tropical oceans is less frequent because these surfaces do not warm rapidly. Outside the tropics, thunderstorm formation is more seasonal occurring in those months where heating is most intense.
Figure 7t-6 describes the annual average number of thunderstorm days across the United States. According to this map, the greatest incidence of thunderstorms occurs in the southeast and in parts of Colorado, Arizona, and New Mexico. This particular spatial distribution suggests that extreme solar heating is not the only requirement for thunderstorm formation. Another important prerequisite is the availability of warm moist air. In the United States, the Gulf of Mexico supplies adjacent continental areas with moist maritime tropical air masses. These air masses are relatively unstable quickly forming cumulonimbus clouds when surface heating is intense. The secondary maximums found in Colorado, Arizona, and New Mexico are due to another climatic factor. All of these areas are on the leeward side of the Rocky Mountains. Mountain slopes in these areas that face the Sun absorb more direct solar radiation and become relatively warmer creating strong updrafts that form into cumulus clouds. If the differential heating is also supplemented by winds from the east, the cumulus clouds are further enhanced to become thunderstorms. Few thunderstorms occur along the west coast of the United States. This region is dominated by cool maritime polar air masses which suppress convectional uplift over land.
| Figure 7t-6: Average number of thunderstorm days per year in the United States. (Source: Oklahoma Climatological Survey). |
Severe Thunderstorms
Most thunderstorms are of the variety described above. However, some can form into more severe storms if the conditions exist to enhance and prolong the mature stage of development. Severe thunderstorms are defined as convective storms with frequent lighting, accompanied by local wind gusts of 97 kilometers per hour, or hail that is 2 centimeters in diameter or larger. Severe thunderstorms can also have tornadoes!
In most severe thunderstorms, the movement of the storm, in roughly an easterly direction, can refresh the storm's supply of warm humid air. With a continual supply of latent heat energy, the updrafts and downdrafts within the storm become balanced and the storm maintains itself indefinitely. Movement of the severe storm is usually caused by the presence of a mid-latitude cyclone cold front or a dry line some 100 to 300 kilometers ahead of a cold front. In the spring and early summer, frontal cyclones are common weather events that move from west to east in the mid-latitudes. At the same time, the ground surface in the mid-latitudes is receiving elevated levels of insolation which creates ideal conditions for air mass thunderstorm formation. When the cold front or dry line of a frontal cyclone comes in contact with this warm air it pushes it like a bulldozer both horizontally and vertically. If this air has a high humidity and extends some distance to the east, the movement of the mid-latitude cyclone enhances vertical uplift in storm and keeps the thunderstorms supplied with moisture and energy. Thus, the mid-latitude cyclone converts air mass thunderstorms into severe thunderstorms that last for many hours. Severe thunderstorms dissipate only when no more warm moist air is encountered. This condition occurs several hours after nightfall when the atmosphere begins to cool off.
Figure 7t-7 illustrates the features
associated with a severe thunderstorm. This storm would
be moving from left to right because of the motion associated
with a mid-latitude cyclone. The upper-level dry air
wind is generated from the mid-latitude cyclone. It causes
the tilting of vertical air currents within the storm
so that the updrafts move up and over the downdrafts.
The green arrows represent
the updrafts which are created as warm moist air is forced
into the front of the storm. At the back end of the cloud,
the updrafts swing around and become downdrafts (blue
arrows). The leading edge of the downdrafts
produces a gust
front near the surface. As the gust front passes,
the wind on the surface shifts and becomes strong with
gusts exceeding 100 kilometers per hour, temperatures
become cold, and the surface pressure rises. Warm moist
air that rises over the gust front may form a roll
cloud. These clouds are especially prevalent
when an inversion exists near the base of the thunderstorm.

| Figure 7t-7: Model of the major features and circulation patterns associated with a severe thunderstorm. |
Some severe thunderstorms develop a strong vertical updraft, commonly known as a mesocyclone. Mesocyclones measure about 3 to 10 kilometers across and extend from the storm's base to its top. They are also found in the southwest quadrant of the storm. In some cases, mesocyclones can overshoot the top of the storm and form a cloud dome (Figure 7t-7). About half of all mesocyclones spawn tornadoes. When a tornado occurs, the mesocyclone lengthens vertically, constricts, and spirals down to the ground surface. Scientists speculate that mesocyclones form when strong horizontal upper air winds interact with normally occurring updrafts. The shearing effect of this interaction forces the horizontal wind to flow upward intensifying the updraft.
Tornadoes
A tornado is a vortex of rapidly moving air associated with some severe thunderstorms (see Figure 7t-8). Tornadoes that travel across lakes or oceans are called waterspouts. Winds within the tornado funnel may exceed 500 kilometers per hour. High velocity winds cause most of the damage associated with these weather events. Tornadoes also cause damage through air pressure reductions. The air pressure at the tornado center is approximately 800 millibars (average sea-level pressure is 1013 millibars) and many human made structures collapse outward when subject to pressure drops of this magnitude. The destructive path of a tornado is usually about half a kilometer wide, and usually no more than 25 kilometers long. However, a spring tornado in 1917 traveled 570 kilometers across Illinois and Indiana lasting well over 7 hours.
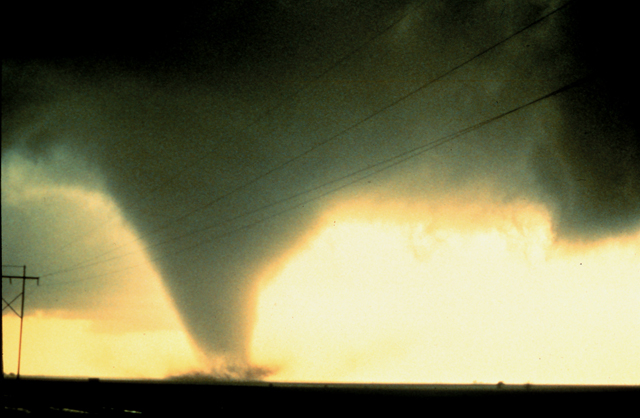
| Figure 7t-8: Tornado photographed on June 2, 1995 south of Dimmitt, Texas. (Source: NOAA Photo Library - National Severe Storms Laboratory). |
About 74% of all tornadoes have wind speeds between 65 and 181 kilometers per hour. These events are classified according to the Fujita tornado intensity scale as being weak (Table 7t-1). Damage from these tornadoes varies from broken windows and tree branches to shingles blowing off roofs and moving cars pushed from roads. Weak tornadoes have a path that is about 1.5 kilometers long and 100 meters wide, and they generally last for only 1 to 3 minutes. According to the Fujita scale, strong tornadoes can have wind speeds between 182 and 332 kilometers per hour. These phenomena cause considerable damage and occur about 25% of the time. Strong tornadoes can have a course up to 100 kilometers long and half a kilometer wide, and they can last for more than 2 hours. The rarest tornadoes are those with either a F4 or F5 rating. These events have wind speeds between 333 to 513 kilometers per hour and are very destructive and violent. F4 tornadoes occur only about 1% of the time, while F5 are even more rare with a chance of about 1 in 1000 of happening.
Table 7t-1: Fujita tornado intensity scale.
|
F-Scale |
Category |
Kilometers per Hour (Miles per Hour) |
Comments |
|
0 |
Weak |
65-118 (40-73) |
Damage is light. Chimneys on houses may be damaged; trees have broken branches; shallow-rooted trees pushed over; some windows broken; damage to sign boards. |
|
1 |
Weak |
119-181 (74-112) |
Shingles on roofs blown off; mobile homes pushed off foundations or overturned; moving cars pushed off roads. |
|
2 |
Strong |
182-253 (113-157) |
Considerable damage. Roofs torn off houses; mobile homes destroyed; train boxcars pushed over; large trees snapped or uprooted; light-objects thrown like missiles. |
|
3 |
Strong |
254-332 (158-206) |
Damage is severe. Roofs and walls torn off better constructed homes, businesses, and schools; trains overturned; most trees uprooted; heavy cars lifted off ground and thrown some distance. |
|
4 |
Violent |
333-419 (207-260) |
Better constructed homes completely leveled; structures with weak foundation blown off some distance. |
|
5 |
Violent |
420-513 (261-318) |
Better constructed homes lifted off foundations and carried considerable distance where they disintegrate; trees debarked; cars thrown in excess of 100 meters. |
Tornadoes occur in many parts of the world. Some notable hots spots include South Africa, Australia, Europe, New Zealand, northern India, Canada, Argentina, Uruguay, and the United States. Of these locations, the United States has some specific regions within its boundaries that have an extremely high number of events per year. Figure 7t-9 describes the spatial distribution of tornado frequency in the United States. The highest number of tornadoes occurs in the southern plains (also called Tornado Alley), south of Lake Michigan, and west central Florida.
| Figure 7t-9: Average number of tornadoes per year in the United States. (Source: Oklahoma Climatological Survey). |
Tornado occurrence has some interesting temporal characteristics. In the United States, most tornadoes occur in April, May, June, and July (Figure 7t-10). It is during these months that we get the conditions necessary for the formation of severe thunderstorms. Tornadoes also have particular times of the day in which they form. Most tornadoes form in the afternoon and early evening. During this eriuod of time, the Earth's surface is reaching its maximum daily temperature because of the continued absorption of solar radiation. Large amounts of this heat energy are also being transfered by conduction and convection into the atmosphere creating strong rapidly rising updrafts. If these updrafts influence the vertical development of a thunderstorm, they can also result in the formation of a tornado.
 |
 |
| Figure 7t-10: Average number of tornadoes per month and per hour of the day in the United States. (Source: Oklahoma Climatological Survey). |
In the United States, about 40,000 tornadoes have occurred in the last fifty years (1950-1999). Data for the period 1916 to 1996 indicates that the frequency of tornadoes in the United States has increased substantially (Figure 7t-11). However, part of this trend may be due to increased population densities. More people per unit area means a greater chance of seeing this relatively rare weather event. Two other factors that could also be responsible for the perceived increase in tornado numbers may be satellite imaging and weather radar. Both of these technologies allow us to pinpoint the thunderstorms that may generate funnels.
Total damage from tornadoes over the last 50 years has been estimated to be about 25 billion dollars. Tornadoes also take a heavy toll on human lives. Table 7t-2 describes the ten deadliest tornado events in the United States. However, weather forecasting technology has played an important role in reducing the number of lives lost (Figure 7t-11). In the decade of the 1930s, before the advent of severe weather forecasting, 1945 people were killed by tornadoes. From 1986 to 1995, only 418 individuals perished suggesting a 90% decrease in fatalities. This reduction is even more astonishing when you consider that the population of the United States doubled from 1935 to 1990.
Table 7t-2: Ten deadliest tornado events in the United States.
| DATE |
LOCATION(S) |
DEATHS |
| March 18, 1925 |
Missouri, Illinois, Indiana |
689 |
| May 6, 1840 |
Natchez, Mississippi |
317 |
| May 27, 1896 |
St. Louis, Missouri |
255 |
| April 5, 1936 |
Tupelo, Mississippi |
216 |
| April 6, 1936 |
Gainesville, Georgia |
203 |
| April 9, 1947 |
Woodward, Oklahoma |
181 |
| April 24, 1908 |
Amite, Louisiana and Purvis,
Mississippi |
143 |
| June 12, 1899 |
New Richmond, Wisconsin |
117 |
| June 8, 1953 |
Flint, Michigan |
115 |
| May 11, 1953 |
Waco, Texas |
114 |
| Figure 7t-11: Average number of tornadoes and tornado fatalities per year in the United States for the period 1916 to 1996. (Source: Oklahoma Climatological Survey). |
Oklahoma, May 3, 1999
Tornadoes can cause considerable damage to natural and human made structures on the Earth's surface. Often, they also cause the injury and death of people. One particular event that set new monetary records in destruction occurred in Oklahoma on May 3, 1999. The destruction from this meteorological event began at 4:45 in the afternoon and ended about six hour later. During this time period, about 70 tornadoes were spawned along a 240-kilometer long swath that began in southwest Oklahoma.
Oklahoma receives more tornadoes per square kilometer than any other region found on our planet. It also receives most of these severe events in the month of May when warm moist air from the Gulf of Mexico interacts with cold fronts descending from the northwest. On the morning of May 3rd, forecasters at NOAA's Storm Prediction Center predicted only a slight risk for severe weather across parts of Oklahoma, Texas, and Kansas. However, by the afternoon conditions for tornado generation had improved greatly. Clearing skies provided the solar radiation required to increase surface temperatures and enhance convective development of severe thunderstorms. A kink in the jet stream, known as a short wave, strengthened upper air winds traveling from the east. Strong upper air winds have a tendency to enhance the vertical mesocyclonic circulation occurring inside developing thunderstorms. This information was added to the high-resolution computer forecast model at the Storm Prediction Center. At 3:49, the Storm Prediction Center updated the forecast and issued a tornado watch. Less than an hour later the damage began.
The greatest damage on May 3 occurred when the funnels cut through Oklahoma City (Figure 7t-12). The damage to the urban area stretched over 60 kilometers and was at times more than a kilometer wide. In some places, winds from the funnel were traveling about 420 to 510 kilometers per hour! More that 2500 buildings were destroyed and another 7500 were damaged. Total damage to structures and other property was estimated to be about 1.2 billion dollars. The toll on human life, for the entire state, was 40 individuals. This number would have certainly been much higher if radio and television warning systems did not exist.
| Figure 7t-12: Tornado paths in and around Oklahoma City on May 3, 1999. Individual tornado tracks are identify by different colors. Tornado intensity is given by Fujita Scale values. Note that the largest tornado track, that cuts through the center of the city, has intensity values recorded along its entire path. (Source: NOAA National Weather Services South Region - The Central Oklahoma Tornado Outbreak of May 3, 1999). |