Introduction
The term humidity describes the fact that the atmosphere can contain water vapor. The amount of humidity found in air varies because of a number of factors. Two important factors are evaporation and condensation. At the water/atmosphere interface over our planet's oceans large amounts of liquid water are evaporated into atmospheric water vapor. This process is mainly caused by absorption of solar radiation and the subsequent generation of heat at the ocean's surface. In our atmosphere, water vapor is converted back into liquid form when air masses lose heat energy and cool. This process is responsible for the development of most clouds and also produces the rain that falls to the Earth's surface.
Scientists have developed a number of different measures of atmospheric humidity. We are primarily interested in three of these measures: mixing ratio, saturation mixing ratio, and relative humidity. Mixing ratio is a measure that refers to the mass of a specific gas component relative to the mass of the remaining gaseous components for a sample of air. When used to measure humidity mixing ratio would measure the mass of water vapor relative to the mass of all of the other gases. In meteorological measurements, mixing ratio is usually expressed in grams of water vapor per kilogram of dry air. Saturation mixing ratio refers to the mass of water vapor that can be held in a kilogram of dry air at saturation. Saturation can be generally defined as the condition where any addition of water vapor to a mass of air leads to the condensation of liquid water or the deposition of ice at a given temperature and pressure. The data in Table 8c-1 indicates that warmer air has a higher saturation mixing ratio than cooler air at a constant atmospheric pressure. It is important to note that this relationship between temperature and water vapor content in the air is not linear but exponential. In other words, for each 10° increase in temperature, saturation mixing ratio increases by a larger quantity.
Table 8c-1: Saturation mixing ratio (at 1000 mb).
|
Temperature Degrees Celsius |
Vapor (g) per Kilogram of Dry Air |
|
50 |
88.12 |
|
40 |
49.81 |
|
30 |
27.69 |
|
20 |
14.85 |
|
10 |
7.76 |
|
0 |
3.84 |
The most commonly used measure of humidity is relative humidity. Relative humidity can be simply defined as the amount of water in the air relative to the saturation amount the air can hold at a given temperature multiplied by 100. Air with a relative humidity of 50% contains a half of the water vapor it could hold at a particular temperature. Figure 8c-1 illustrates the concept of relative humidity.
| Figure 8c-1: The following illustration describes how relative humidity changes in a parcel of air with an increase in air temperature. At 10° Celsius, a parcel of dry air weighing one kilogram can hold a maximum of 7.76 grams of water vapor (see Table 8c-1). In this state, the parcel of air would be at saturation and its relative humidity would be 100%. Increasing the temperature of this parcel, without adding or removing any water, would increase its ability to hold water vapor. According to Table 8c-1, a 10 degree Celsius rise in temperature would increase the saturation mixing ratio of this parcel of air to 14.85 grams. Since no water has been added or removed, the actual amount of water in the parcel would remain 7.76 grams. This quantity is known as the mixing ratio. Dividing the mixing ratio by the saturation mixing ratio and then multiplying this number by 100 determines the relative humidity of the parcel of air (7.76/14.85 x 100 = 52%). At a temperature of 20° Celsius, relative humidity would be 52%. Raising the temperature of the parcel of air by another 10° Celsius would again lower its relative humidity. In this state, the actual mixing ratio would still be 7.76 grams, while the saturation mixing ratio would increase to 27.69 grams. Relative humidity would drop to 28% at a temperature of 30° Celsius (7.76/27.69 x 100 = 28%). |
Measuring Humidity
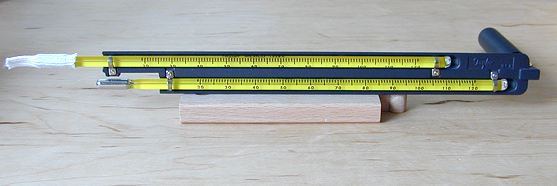
Humidity can be measured using a variety of instruments. Relative humidity is often determined using a sling psychrometer or a hair hygrometer. A sling psychrometer is a device that consists of two thermometers joined to a piece of plastic or metal (Figure 8c-2). One of the thermometers, called the wet-bulb thermometer, has small cloth hood (wick) that is pulled over the reservoir bulb. The other thermometer has no hood and is called the dry-bulb thermometer. At one end of instrument is a rotating handle. To use the sling psychrometer, the wick is moistened with clean water and the device is twirled in the air using the handle. As the device is spun in the air, evaporation of the water from the wet-bulb thermometer occurs cooling it. The amount of evaporation and cooling taking place is controlled by the dryness of the air. If the air is saturated, the wet-bulb and dry-bulb thermometers would have the same temperature because no evaporation can occur. After a few minutes of twirling, the temperatures of the wet-bulb and dry-bulb thermometers are determined, a value called the wet-bulb depression is calculated (dry-bulb minus wet-bulb temperature), and a psychrometric table is used to find the corresponding relative humidity from the dry-bulb temperature and wet-bulb depression.
|
Figure
8c-2: Sling psychrometer. Note
the wet-bulb thermometer is located on top. |
Hair hygrometers work on the fact that hair changes its length when humidity varies. This device usually consists of a number of human or horse hairs connected to a mechanical lever system. When humidity increases the length of the hairs becomes longer. This change in length is then transmitted and magnified by the lever system into a measurement of relative humidity.
Humidity is also measured on a global scale using remotely placed satellites (Figure 8c-3). These satellites are able to detect the concentration of water in the troposphere at altitudes between 4 and 12 kilometers. Satellites that can measure water vapor have sensors that are sensitive to infrared radiation. Water vapor specifically absorbs and re-radiates radiation in this spectral band. Satellite water vapor imagery plays an important role in monitoring climate conditions (like the formation of thunderstorms) and in the development of future weather forecasts.
Figure 8c-3: GOES-8 satellite image of atmospheric water vapor over the United States and southern Canada. Light toned areas have high vapor content, while black regions have low concentrations of water vapor. In the animation, you can see the general west to east movement of water vapor across North America. The diagonal line in the southeast corner of the image separating areas of high and low vapor content is a cold front. This animation is for the period 3:15 to 18:15 Greenwich Mean Time, October 5, 1999. (To view this animation your browser must have Apple's QuickTime plug-in. The QuickTime plug-in is available for Macintosh and Windows operating system computers and can be downloaded FREE from the World Wide Web site www.apple.com/quicktime). |
Dew Point and Frost Point
Associated with relative humidity is dew point (if the dew point is below freezing, it is referred to as the frost point). Dew point is the temperature at which water vapor saturates from an air mass into liquid or solid usually forming rain, snow, frost, or dew. Dew point normally occurs when a mass of air has a relative humidity of 100%. This happens in the atmosphere as a result of cooling through a number of different processes.